
This article is from Mercola.com. IF you are looking for alternatives, we have some simple solutions to avoid fluorinated water. Check us out at www.nevadachiro.com
Paul Connett, co-author of the book, The Case Against Fluoride, is joined by his wife, Ellen, webmaster of the Fluoride Action Network (FAN), and Tara Blank, PhD, Science Liason Officer for FAN, in authoring this article on fluoride and the brain. Together they have recently provided an extensive commentary in response to the EPA’s Office of Drinking water in response to its proposed safe reference dose for fluoride1.
In an ongoing effort to determine which chemicals may damage the developing brain, scientists from the U.S. Environmental Protection Agency (EPA) recently conducted an extensive literature review of over 400 chemicals, including fluoride.
Fluoride is Classified as a Neurotoxin
While the Centers for Disease Control (CDC) would have us all believe that fluoride is perfectly innocuous and safe, scientists from the EPA’s National Health and Environmental Effects Research Laboratory have classified fluoride as a “chemical having substantial evidence of developmental neurotoxicity”.2 Consistent with the EPA’s conclusion, a continually growing body of human and animal research strongly suggests that fluoride can damage the developing brain.
Consider for example:
- 24 studies have now reported an association between fluoride exposure and reduced IQ in children
- Three studies have reported an association between fluoride exposure and impaired neurobehavioral development
- Three studies have reported damage to the brain of aborted fetuses in high fluoride areas, and
- Over 100 laboratory studies have reported damage to the brain and/or cognitive function among fluoride-exposed animals3.
Most of the 30 studies linking fluoride to reduced IQ, impaired neurobehavioral development, and fetal brain damage have come from China where fluoride occurs at moderate to high levels in the drinking water in what is known as “endemic areas for fluorosis.” While there have been shortcomings in the methodologies of some of these studies, they have been remarkably consistent in their findings. Children exposed to excessive fluoride have been consistently observed to suffer from some form of neurological impairment.
Your Brain Under Attack
Statistics tell us that our brains are under attack. For example:
- Autism Spectrum Disorders: The rates in the U.S. are now 1 in 110 children and are “4 to 5 times more likely to occur in boys than in girls,” or as many as 1 in 60 boys.
- Attention Deficit Hyperactivity Disorder: According to a November 2010 CDC report, nearly 1 in 10 U.S. children have ADHD – an increase of about 22 percent from 2003.
- Alzheimer’s Disease: According to the Alzheimer’s Association, 5.4 million Americans are living with it and every 69 seconds an American is diagnosed with it. By 2050, it is estimated that as many as 16 million Americans will have the disease.
We do not know the causes for the alarming increases in these diseases but we do know that wherever possible, everything must be done by regulatory agencies and caregivers to protect the brain from known neurotoxins. Fluoride is a known neurotoxin and it is time to stop adding it to public drinking water systems. However, convincing U.S. regulatory authorities of this urgent necessity is proving very difficult.
Developmental Neurotoxicity
In 2007 Choi and Grandjean4 stated:
“In humans, only five substances have so far been documented as developmental neurotoxicants: lead, methylmercury, polychlorinated biphenyls, arsenic, and toluene. From this evidence, including our own studies on some of these substances, parallels may be drawn that suggest that fluoride could well belong to the same class of toxins, but uncertainties remain…”
Health Agencies are Ignoring Fluoride-Brain Studies
Even though health agencies in the U.S. and other fluoridating countries have recognized that children are being grossly over-exposed to fluoride (41 percent of American children aged 12-15 now have some form of dental fluorosis5), they are unwilling to concede that fluoride may be impacting the brain. Their approach has been either to ignore these studies completely or to challenge the relevance and the methodology of the fluoride-brain studies. They have thus far failed to conduct any IQ studies of their own.
Bottle-Fed Babies at Risk
The level of fluoride in mothers’ milk is remarkably low; only about0.004 ppm6. In the view of many critics of fluoridation, including Arvid Carlsson, Nobel laureate in medicine/physiology, it is reckless to expose infants to levels of fluoride orders of magnitude higher than that found in breast milk.
In the U.S., infants who are fed formula reconstituted with fluoridated tap water receive the highest levels of fluoride (per kilogram bodyweight) in the human population. Specifically, infants who are fed formula made with fluoridated water at the current level of 1 part-per-million (1 ppm = 1 mg/liter) fluoride will receive a dose up to 250 times more than the breastfed infant.
Even with the proposal by the U.S. Department of Health and Human Services to lower fluoride to 0.7 ppm in fluoridation schemes, bottle-fed infants will still receive up to 175 times more fluoride than the breastfed infant.
In addition to bottle-fed infants, others at heightened risk include those with poor nutrition and both African American and Mexican-American children.
Recent studies indicate that African American and Mexican-American children have higher rates of the more severe forms of dental fluorosis than white children7. As dental fluorosis provides a visual indication that fluoride has exerted a toxic effect on your body, it is reasonable to assume that these same children will also be more vulnerable to other toxic effects of fluoride including damage to the brain.
EPA Protecting Fluoridation Program, Not Public Health
On January 7, 2011, the EPA’s Office of Water (OW), while pursuing its mandate to set a new safe drinking water standard for fluoride, made it clear that it would do so without jeopardizing the water fluoridation program. According to Peter Silva, EPA Assistant Administrator for the OW:
“EPA’s new analysis will help us make sure that people benefit from tooth decay prevention while at the same time avoiding the unwanted health effects from too much fluoride”8.
Silva was referring to severe dental fluorosis, broken bones, and skeletal fluorosis as the unwanted health effects. These were the three health effects that the National Research Council of the National Academies in its 2006 report Fluoride in Drinking Water: A Scientific Review of EPA’s Standards singled out. The report recommended that the EPA perform a new health risk assessment to determine a safe drinking water standard for fluoride because they found the current level of 4 ppm was not protective of health.
In its first draft risk assessment, EPA claimed that the most sensitive health effect of fluoride was severe dental fluorosis9. Brain effects were ignored by EPA even though many more studies have been published since the NRC made its recommendation. Science does not stand still.
The NRC examined five IQ studies; there have now been nearly five times more at 24!
Making matters worse, the EPA’s Office of Water risk assessment excluded the fetus and infants under 6 months of age, as the EPA does not expect them to get dental fluorosis! Whether fluoride impacts the growing tooth enamel during this period or not, this is a very important period for brain development. As noted above, an infant fed formula made with fluoridated water at the proposed lower level of 0.7 ppm will receive 175 times more fluoride than the breast-fed infant.
EPA Research Laboratory Takes Different View
Fortunately, the EPA does not speak with a single voice on fluoride’s neurotoxicity. While the EPA’s Office of Water ignored any brain effect in its 2011 risk assessment, the Neurotoxicology Division at the EPA’s National Health and Environmental Effects Research Laboratory included fluoride in its list of “Chemicals with Substantial Evidence of Developmental Neurotoxicity”, for a new project expected to be launched this year10.
Ultimately, therefore, the EPA administrator will have to resolve the following question: Is it more important to protect our children’s brains or the fluoridation experiment?
Fluoridation Proponents’ False Claim
Proponents of fluoridation have dismissed the fluoride-IQ studies on the basis of the claim that the children in these studies were drinking water containing fluoride at much higher levels than used for water fluoridation (approximately 1 ppm).
However, such claims do not bear close scrutiny, Xiang11 estimated that the threshold for IQ lowering was 1.9 ppm and more recently Ding et al. (2011) found a lowering of IQ in the range of 0.3 to 3 ppm. These findings reveal that there is no adequate margin of safety to protect ALL American children drinking uncontrolled amounts of fluoridated water and ingesting fluoride from other sources (e.g. toothpaste).
While we will discuss this crucial margin of safety argument in more detail below, suffice it to say here that when harm is found in a small human study a safety factor of 10 to 100 is typically applied in order to extrapolate to a level designed to protect a whole population from harm.
The NRC (2006) Review of Fluoride
The NRC panel devoted a whole chapter on the brain in its 507-page 2006 review and concluded:
“it is apparent that fluorides have the ability to interfere with the functions of the brain and the body by direct and indirect means.“
Of the five IQ studies reviewed by the NRC the panel drew special attention to the study by Xiang et al.12, which they indicated had the strongest design. The panel described this study:
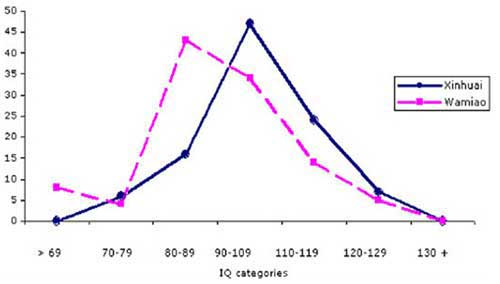
“This study compared the intelligence of 512 children (ages 8-13) living in two villages with different fluoride concentrations in the water. The IQ test was administered in a double-blind manner. The high-fluoride area had a mean water concentration of 2.47 ± 0.79 mg/L (range 0.57-4.50 milligrams per liter [mg/L]), and the low-fluoride area had a mean water concentration of 0.36 ± 0.15 mg/L (range 0.18-0.76 mg/L). The populations studied had comparable iodine and creatinine concentrations, family incomes, family educational levels, and other factors.
The populations were not exposed to other significant sources of fluoride, such as smoke from coal fires, industrial pollution, or consumption of brick tea. Thus, the difference in fluoride exposure was attributed to the amount in the drinking water… the average intelligence quotient (IQ) of the children in Wamiao was found to be significantly lower (92.2 ± 13.00; range, 54-126) than that in Xinhuai (100.41 ± 13.21; range, 60-128).
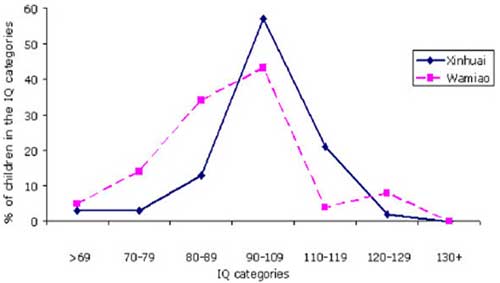
The IQ scores in both males and females declined with increasing fluoride exposure.”
The shift in the IQ curves for both males and females are shown in Figures 1 and 2.
Figure 1. Distribution of IQ scores from males in Wiamiao and Xinuai. Source: data from Xiang et al. 2003a (as shown in NRC, 2006, Figure 7-2, p. 207).
Figure 2. Distribution of IQ scores from females in Wiamiao and Xinuai. Source: data from Xiang et al. 2003a (as shown in NRC, 2006, Figure 7-1, p. 207).According to the NRC (p. 206):
“A follow-up study to determine whether the lower IQ scores of the children in Wamiao might be related to differences in lead exposure disclosed no significant difference in blood lead concentrations in the two groups of children13.”
Xiang extrapolating from the whole set of data estimated that the threshold for IQ lowering would be 1.9 ppm. Below we use this estimate in a margin of safety analysis to calculate a level that would be sufficient to protect all children drinking fluoridated water.
The NRC panel’s overall conclusion based on its review of these five IQ studies was:
“A few epidemiologic studies of Chinese populations have reported IQ deficits in children exposed to fluoride at 2.5 to 4 mg/L in drinking water. Although the studies lacked sufficient detail for the committee to fully assess their quality and relevance to U.S. populations, the consistency of the results appears significant enough to warrant additional research on the effects of fluoride on intelligence.”
Incredibly, no fluoridating country has followed up on this. We continue to fly blind on this critical issue. One of the animal studies reviewed by the NRC was the study by Julie A. Varner and co-workers14 from the State University of New York at Binghamton. These authors fed rats for one year with 1 ppm fluoride in their water. One group received sodium fluoride, the other aluminum fluoride.
In the rats treated with either fluoride compound, Varner et al. discovered the following:
- Morphological changes in the kidney and the brain
- An increased uptake of aluminum into the brain
- The formation of beta-amyloid deposits, which are a hallmark for Alzheimer’s disease
More Brain Studies Published Since NRC 2006 Review
Since the NRC panel wrote its report in 2006 many more animal studies have been published and another 14 IQ studies have either been published or translated. Five more IQ studies wait translation from the original Chinese. This brings the total to 24 IQ studies that have found exposure to fluoride associated with lowered IQ15.
At least 16 studies on animals have shown that fluoride has an effect upon the hippocampus and nine of these have been published since the NRC’s 2006 review. Damage in this area of your brain usually results in difficulties in forming new memories and recalling events that occurred prior to the damage16.
Xiang Updates His Work17
An updated version of Xiang et al.’s (2003a) work18, which included new information about the relationship between the level of fluoride in the children’s plasma and IQ was accepted for publication in Environmental Health Perspectives (the journal of the National Institute of Environmental Health Sciences) and made available online on December 17, 2010.
This article was later withdrawn when it was found that some of the material had been previously published. However, for those who have used criticisms of the methodologies of some of the 24 IQ studies to justify ignoring the issue completely, it is important to note that the Xiang et al. paper successfully passed the peer-review process of this important journal.
Another Important Fluoride IQ Study
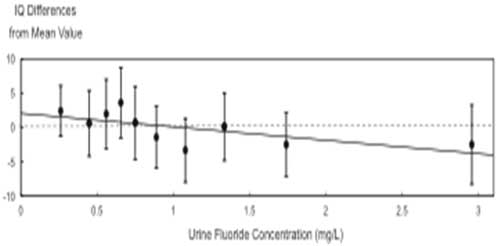
An IQ study published in 2011 by Ding et al.19 investigated the effects of low levels of fluoride on IQ. Children were exposed to 0.3 to 3 mg F/L fluoride via drinking water. The authors found a very significant linear correlation (p <0.0001) between fluoride levels in the children’s urine and lowered IQ (Figure 3). They calculated that there will be a lowering of IQ by 0.59 points for each increase of 1 mg/L urinary fluoride.
Figure 3. The relationship between IQ differences and urine fluoride concentrations. Multiple linear regression model was carried out to confirm the association with urine fluoride exposure and IQ scores (F=9.85, p < 0.0001) (Figure 2, Ding et al., 2011)
Margin of Safety: The Safety Factors Used in Toxicological Assessments
Promoters of fluoridation, either through ignorance or design, betray little understanding of the concept of margin of safety. This is revealed when they dismiss studies carried out at levels higher than 1 ppm as being irrelevant for assessing the risks posed by water fluoridation.
This indicates that they have no appreciation of the difference between concentration and dose.
Someone drinking three liters of water with 1 ppm fluoride would get a higher dose (3 mg) than someone drinking one liter of water with 2 ppm fluoride (2 mg). In other words, it is the dose that hurts people, and thus finding harm at levels as high as 4 ppm are still relevant to a high water consumer drinking water at 1 ppm.
Toxicologists usually have to work from high dose animal experiments to extrapolate to a safe level for humans.
This typically requires the application of a safety factor of 10, when extrapolating from the dose that causes harm in animals to predict a safe dose for humans (in order to account for the potential variation between species). Then a second safety factor of 10 is commonly applied to take into account the full range of sensitivity to any toxic substance that is to be expected in any large population. In other words some individuals are likely to be 10 times more sensitive to fluoride than others.
In the case of fluoride we are in the unusual situation of having quite a large amount of human data to work with, especially in the case of its neurotoxic effects, so it is only necessary to address the variation in sensitivity expected in a large population.
In its January 7, 2011, draft risk assessment the EPA Office of Water took the most unusual tack of not using any safety factor at all when extrapolating from the dose that causes severe dental fluorosis20.
In other words they believed that they had enough data to state – with no uncertainty—that no one consuming less than 0.08 mg of fluoride per kilogram bodyweight per day would develop severe dental fluorosis. For them to legitimately forego any safety factor they need to demonstrate that this purported “threshold” dose is based on sufficiently large numbers of subjects to represent the full range of different vulnerabilities and sensitivities in the U.S. population.
Such variations include: age, income levels, nutritional status, genetic and ethnic variability.
It is notable therefore, that the study on which the EPA’s calculations were based21 did not include African American or Mexican-American children, or children from a full range of family income levels.
Dr. Paul Connett, director of the Fluoride Action Network believes that the EPA Office of Water was forced to choose this “uncertainty factor” of 1 in order to produce a “safe reference dose” that was higher than the dose deemed necessary to protect teeth against decay. In other words, this was a political decision made to protect the water fluoridation program. Even more political was the EPA’s willingness to ignore the studies that indicate that fluoride lowers IQ.
No Margin of Safety for Fluoride
The level at which Ding et al. (2011) researchers found a lowering of IQ (0.3-3 ppm) overlaps the range at which fluoride is added to water in the US (0.7 – 1.2 ppm). Even without applying a safety margin to this finding, it would suggest that there is no safe level that would protect ALL of America’s children from potential interference with mental development from fluoride exposure via the water supply.
However, Ding et al. state that this is a preliminary finding, and more work should be done to control for possible confounding factors. Meanwhile, it is possible to use the findings of Xiang et al.22 to estimate a safe reference dose to protect all American children from this effect.
This is the task that the EPA Office of Water should have undertaken.
However, as indicated above, their preliminary calculations for the safe reference dose published on January 7, 2011, failed to consider fluoride’s potential to lower IQ. The EPA defended its decision to only consider severe dental fluorosis, by claiming that this is the most sensitive endpoint of fluoride’s toxicity. The EPA made this claim despite the fact that, in both the Ding and Xiang studies, reductions in IQ were observed among children without severe dental fluorosis. This clearly challenges the EPA’s claim that severe dental fluorosis is the most sensitive adverse effect of fluoride.
Other Human Brain Studies
Three other studies from China23 indicate that aborted fetuses in endemic areas for fluorosis show signs of brain changes compared to aborted fetuses in non-endemic areas.
Moreover, in a study from Mexico24, Rocha-Amador et al found that children exposed to moderate levels of fluoride had impaired visual-spatial recognition abilities. Such impairments could affect a child’s development. In 2009 the Rocha-Amador team performed tests25 on children exposed to various neurotoxicants (Fluoride, Arsenic, Lead, DDT, DDE or PCBs). Fluoride exposed children were selected if they had dental fluorosis (a bio-marker for fluoride over-exposure).
All the children exposed to the various neurotoxicants “had very poor performance in Copy and Immediate Recall tests and in general they recalled less information on the Construction/Memory score.”
As the authors of these studies note, fluoride’s impact on the brain may be evident in the absence of crude reductions in IQ. Indeed, the authors note that IQ tests may well fail to detect fluoride’s more subtle effects on cognitive function.
Consistent with Rocha-Amador’s research on non-IQ effects, Li et al.26 reported that infants born in areas with high fluoride levels had “significant differences in the non-biological visual orientation reaction and biological visual and auditory orientation reaction” compared to infants born in areas with low fluoride levels.
Establishing a Safe Drinking Water Level for Fluoride MCLG
The most important step in setting a federally enforceable safe drinking water standard (maximum contaminant level or MCL) is the determination of the Maximum Contaminant Level Goal (MCLG). This determination is made by the EPA’s Office of Water. The MCLG is the level of a contaminant in water below which there is no known or reasonably anticipated risk to health.
The MCLG is the basis for setting the enforceable standard (MCL).
This enforceable standard takes into account the cost of removing the contaminant and is therefore not as protective as the MCLG level. For example the MCLG for arsenic is zero, but the MCL is set at 15 ppb (parts per billion) due to the costs of removing natural arsenic from some water supplies. For fluoride, Xiang et al. (2003a, b) estimated that the lowest water concentration associated with a lowering of IQ was 1.9 mg F/L. Ironically, this is the same threshold that the EPA’s Office of Water offers for severe dental fluorosis.
We convert this to a dose by assuming that the children in the Xiang study were consuming on average one liter of water a day. One liter of water at 1.9 mg F/L translates into a dose of 1.9 mg/day. This is called the lowest observable adverse effect level (LOAEL).
Because these studies only dealt with 500 children, with fairly similar genetics, lifestyles and nutritional status, we would need at least the standard uncertainty factor of 10 to account for the full range of sensitivity expected in the whole population in the U.S. to arrive at a safe daily dose. 1.9 mg F/day divided by 10 equals 0.19 mg F/day and thus a safe daily dose should be set no higher than this. Such a dose would be exceeded by a child drinking less than one glass of water (250 ml) at 1 ppm (1 ppm = 1 mg/liter).
In other words water fluoridation is not safe; some children could have their mental development impaired by drinking as little as one glass of fluoridated water on a daily basis.
As far as setting a maximum contaminant level goal (MCLG) for safe drinking water is concerned, we should note that this safe daily dose of 0.19 mg/day is already being exceeded from other sources.
For example the EPA OW estimates that mean fluoride ingestion from toothpaste among children between the ages of 1 and 4 is 0.34 mg/day27. Fluoride intake from toothpaste alone, therefore, contributes twice the safe daily dose of 0.19 mg/day. Thus, since some children will exceed the safe dose of fluoride from non-water sources alone, it is difficult to understand how the MCLG for fluoride could be set any higher than ZERO if the EPA were to acknowledge the existence of these IQ studies and follow routine procedures.
Of all the dangers posed by fluoridation (and there are many others) the potential to impact a child’s mental development must be considered one of the most serious. Just how long can promoters continue to ignore the voluminous evidence of these dangers?
And how long will the public let them?


